How to analyse your own team and the opposition in football through data
Data analysis in football has become an increasingly common tool in professional football. However, having access to a large amount of information does not necessarily mean understanding better what is happening on the pitch.
For data to be truly useful, it is necessary to know what information to analyse, which metrics to use and, above all, how to put them into context.
When analysing a team, we can work from two complementary perspectives: understanding the performance and behaviours of our own team and studying the opposition to identify patterns that may be relevant when preparing for a match.
In this article, we explore some of the main applications of opposition analysis in football and the analysis of our own team from a data-driven perspective.
What Role does data play in football team analysis?
Before analysing a team, it is necessary to understand where the information comes from.
There are different sources of data in football. One of them is manual match-event collection, where what happens on the pitch is recorded. There are also video and tracking systems capable of collecting information about players' positions and movements, as well as devices that allow certain aspects of physical performance to be analysed.
Each source has its own characteristics and limitations. Therefore, one of the first questions an analyst should ask is what information is needed, how it can be obtained and what it will be used for.
The goal is not to accumulate data, but to select the data that can answer the questions raised by the analysis.
Metrics and KPIs: What should we measure?
Once the data has been collected, the next step is to decide which metrics may be useful.
A metric can measure different aspects of the game, while a KPI should provide information that allows certain behaviours to be acted upon, improved or modified. For example, knowing the distance covered by a player can be interesting, but depending on the objective of the analysis, it may be more useful to examine the intensity of those actions.
In football analysis, we can differentiate between different types of indicators:
- Classic metrics: such as goals, shots, saves or goals conceded.
- Advanced metrics: obtained through mathematical calculations and specific models.
- Contextual metrics: related to the team, game model and tactical systems.
This last category is particularly relevant. An isolated piece of data can provide limited information if we do not know the context in which it occurs.
Context Is key to Interpreting Data
One of the main challenges of football performance analysis is avoiding the interpretation of a metric in isolation.
Goalkeeper analysis clearly illustrates this issue. Variables such as save percentage, goals conceded or clean sheets can help describe performance, but they are also influenced by the team the goalkeeper plays for.
A team that concedes very few chances may cause its goalkeepers to record certain statistical figures, without these figures alone being enough to fully explain their individual performance.
For this reason, analysis must take the collective context into account. The same principle applies to tactical analysis: a metric should be interpreted considering the game model, the team's principles and the situation in which it occurs.
How can data be used to analyse your own team?
Own-team analysis makes it possible to identify behaviours, patterns and trends that may be relevant to the work of the coaching staff.
To do this, the analyst can select metrics that are related to the team's game model.
For example, if a team wants to develop a counter-pressing strategy, it may be useful to analyse where the team regains possession after losing the ball and how frequently those recoveries occur in specific areas of the pitch.
For a team that uses a low defensive block, however, the same metric may have a different level of importance.
This shows why there is no universal list of metrics that works in the same way for every team. Indicators should respond to the needs of the game model and the coaching staff.
How to analyse the opposition in football using data
Opposition analysis in football aims to identify patterns that can help us understand how a team plays and which behaviours may be repeated during a match.
Data can be used to study aspects such as:
- Where a team starts its build-up.
- How it takes goal kicks.
- Which areas it uses to progress the ball.
- Where it regains possession.
- What happens after a regain.
- Where specific players receive the ball.
- How it takes corners and other set pieces.
- How its behaviours change depending on the scoreline.
- How its tactical systems evolve.
For example, visualising goal kicks can show whether a team tends to build short or long, which areas it uses and what happens after that initial action.
It is also possible to analyse whether these behaviours change when the team is winning, drawing or losing.
This type of information can be particularly useful when preparing the game plan and developing specific strategies against the opposition.
Identifying playing patterns through data
One of the most interesting applications of data analysis in football is the ability to identify patterns that would be much more difficult to detect by manually reviewing a large number of actions.
For example, transition analysis can show what happens after a regain: where it occurs, how much time passes before the next shot or which area the team progresses towards.
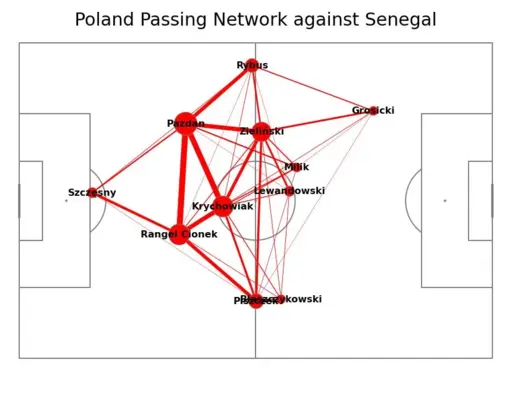
It is also possible to study passes and the areas where specific players receive the ball. This information can be used to understand where a player usually receives possession and to plan specific pressing actions.
In opposition analysis, identifying these patterns can help answer specific questions:
- Where does their most important midfielder receive the ball?
- How do they build up?
- What happens after a regain?
- Which sequences do they use from corners?
- In which areas do they concentrate specific actions?
The answers to these questions make it possible to move from a collection of statistics to a more complete interpretation of the team's behaviour.
From data to tactical information
The value of analysis is not simply in presenting a large amount of statistics.
The analyst's role also involves giving meaning to that information and making it understandable for the coaching staff. To achieve this, data visualisation can be a fundamental tool.
A visual representation can make it possible to quickly identify patterns related to goal kicks, passes, regains, set pieces or player positioning.
Changes in a team's tactical systems can also be studied. Analysing how a system such as a 4-4-2 or 4-3-3 changes and in which situations these changes occur can provide additional information about collective behaviour.
In this way, data does not necessarily replace tactical analysis in football, but it can help formulate questions, identify patterns and guide the analysis.
Advanced metrics also need context
One of the best-known advanced metrics is expected goals (xG), which estimates the probability of a shot resulting in a goal based on different variables related to the shooting situation.
However, even when using advanced metrics, it is important to understand how they are constructed and what information they use. Different xG models can produce different values, so the metric should be understood within the characteristics and limitations of the model being used.
In addition to xG, there are derived metrics such as xGA, expected assists and other metrics related to chance creation and build-up play.
The fundamental idea remains the same: an advanced metric should not be used as a definitive answer, but as a tool within a broader analysis process.
From data analysis to decision-making
Analysing your own team and the opposition from a data-driven perspective involves much more than consulting statistics.
The process begins with collecting information, continues with selecting the relevant metrics and then requires the results to be contextualised, visualised and interpreted.
When this process is well structured, data can help answer specific questions about the game:
- How does our team play?
- What patterns are we repeating?
- How does our opposition play?
- Which behaviours can we anticipate?
- What information can be useful to prepare for the next match?
The ultimate goal is for the analysis to provide valuable information to the coaching staff and contribute to a better understanding of the game and the teams involved.
Opposition analysis in football from a data-driven perspective
The integration of data has expanded the possibilities for team analysis in football. Today, it is possible to study everything from performance metrics to playing sequences, positioning, transitions and tactical variations.
However, having more information does not automatically mean analysing better. The key is to select the right data, understand its context and transform it into information that can be used in daily work.
This connection between data, tactical analysis and decision-making is part of the work of a football analyst and helps provide a better understanding of both your own team's behaviour and that of the opposition.
This content is based on knowledge and materials developed by Jesús Lagos, an expert in tactical and performance analysis in football. To become an expert in football tactical analysis, enrol in the FSI Master’s in Football Tactical Analysis.