From basic statistics to advanced tactical analysis: a brief history
For much of the 20th century, football analysis was based on simple and easily understandable metrics: goals scored, matches won, or position in the table. These data offered a general view of performance, but left out many nuances of the game, such as positioning, decision-making, or the collective impact of players.
With the arrival of new technologies at the end of the 20th century and the beginning of the 21st, the landscape began to change. The digitalization of matches made it possible to collect much more detailed information, from the number of completed passes to the distance covered by each player. This marked the first step toward a deeper analysis, where not only the result mattered, but also how it had been achieved.
In the last decade, the development of so-called advanced analysis has taken this evolution even further. Concepts such as “expected goals” (xG), heat maps, and predictive models have become a regular part of football discourse. These systems not only describe what happens on the field, but also attempt to interpret patterns and anticipate behaviors, offering a more complex understanding of the game.
In addition, professional clubs have integrated specialized data analysis teams into their structures. These analysts work alongside coaches and technical staff to evaluate opponents, optimize strategies, and improve individual and collective performance. Thus, the use of data has shifted from being a complement to becoming a standard tool in decision-making.
This evolution reflects a broader change in the way football is understood: from a view focused solely on results to one that also values processes and context. However, it has also sparked the debate about the extent to which data can capture the essence of such a dynamic and unpredictable sport.
What data analysis really measures in modern football
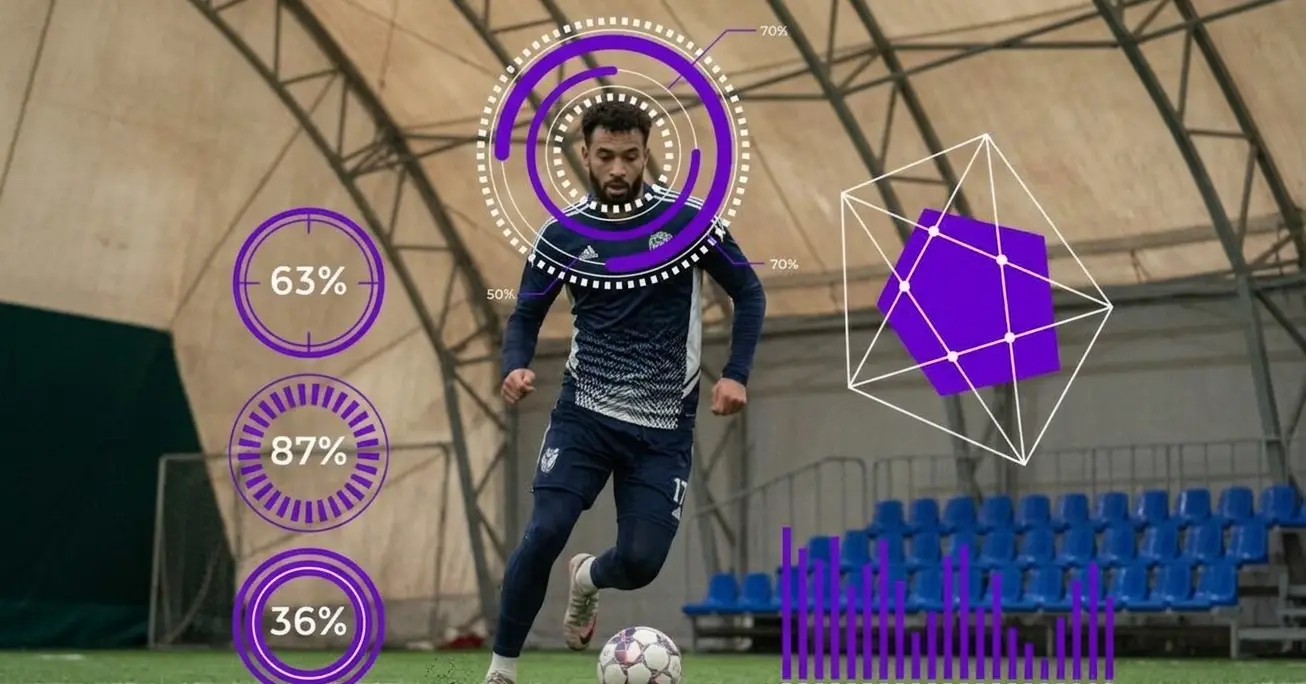
Data analysis in modern football aims to quantify what happens on the field beyond the final result. It is not limited to counting actions, but seeks to measure the quality, context, and impact of each play, both at an individual and collective level.
One of the most well-known concepts is expected goals (xG), a metric that estimates the probability that a chance will result in a goal based on factors such as distance to the goal, shooting angle, type of assist, or defensive pressure. In this way, it is not only analyzed how many goals are scored, but whether a team generates high- or low-quality chances.
Another relevant statistic is PPDA (passes allowed per defensive action), which is used to measure a team’s pressing intensity. The fewer passes a team allows before attempting to recover the ball, the higher its level of pressure. This metric helps to understand playing styles and tactical behaviors that are not always obvious at first glance.
Modern analysis also incorporates positional metrics, which study how players are distributed on the field and how they interact with each other. Through heat maps, passing networks, or movement tracking, it is possible to identify patterns such as space occupation, team compactness, or the creation of passing lanes. These tools make it possible to analyze not only what a player does with the ball, but also their influence without it.
To correctly understand these advanced metrics, it is important to first be clear about the fundamentals of football and its basic principles, since data analysis always starts from how the game is structured at its core.
In addition, there are indicators related to physical performance, such as distance covered, maximum speed, or number of sprints, which provide information about the demands of the game and players’ conditioning.
Overall, these metrics offer a more complete view of the match, combining technical, tactical, and physical data. The goal is not to replace traditional observation, but to complement it with objective information that helps better interpret the development of the game. Football fundamentals: what they are, which ones exist, and how they are developed
Expected Goals (xG): the metric that changed everything
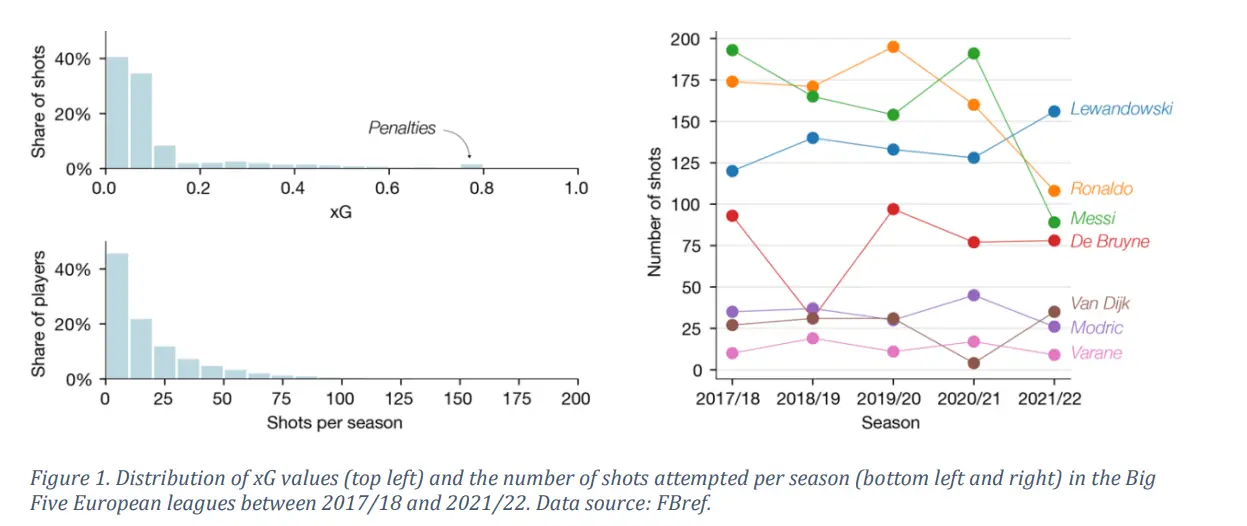
For decades, football analysis was based on a simple question: how many goals did that player score? The problem is that this figure, on its own, says very little. A striker can score 15 goals from very clear chances, or score 10 while having created very little. The final number hides too much. xG (Expected Goals) was introduced to solve precisely that. Instead of counting goals, it measures the quality of each shot: where was it taken from? with which part of the body? how far was the goal? under what defensive pressure? Each shot is assigned a value between 0 and 1 representing the probability that it will result in a goal if taken by an average player. A penalty has an xG of approximately 0.76. A shot from 35 meters at a tight angle may be around 0.02. This metric also led to a way of measuring finishing ability: GAX (Goals Above Expectation), which compares a player’s actual goals with their accumulated xG. If a striker consistently exceeds their expected goals, in theory they are an exceptional finisher.
Up to this point, the logic seems solid. The problem is that, as demonstrated by researchers Jesse Davis and Pieter Robberechts from KU Leuven University in a study published in 2024, xG models contain three important biases that distort this comparison. First: the sample size is too small. In the five major European leagues, only 9% of players reach 50 shots in a season. With so little data, it is almost impossible to determine whether someone exceeds their xG due to real skill or simply luck. The study’s simulations show that even an exceptional finisher, with 25% greater efficiency than average, has only a 70% probability of exceeding their xG in at least four out of five consecutive seasons, assuming they take more than 100 shots per season. For most players, the sample size is insufficient to draw reliable conclusions. Second: not all shots are equal when measuring skill. A shot deflected by a defender does not reflect the attacker’s ability. A desperate attempt in the 94th minute while trailing does not either. Including them in the calculation distorts the result. The study analyzes the case of Paul Pogba to illustrate this: over five Premier League seasons, his overall statistics placed him as a below-average finisher, but when filtering only his long-range shots, where he truly stands out, the numbers changed completely. The problem is that this subset of shots is so small that statistical conclusions again become weak. Third, and most interesting: the model is biased by the very players used to train it. This is the most sophisticated finding of the paper. xG models are built from millions of historical shots, but those shots do not come from “average” players: a significant portion are taken by the world’s best finishers, who shoot more often and more effectively. This causes the model to learn, unintentionally, to assign slightly higher xG values to shots from positions where top finishers usually shoot. The result: the model systematically underestimates the ability of elite finishers and overestimates that of average ones. Messi’s case illustrates this numerically: using a corrected model based on a technique from AI fairness literature (called multi-calibration), the researchers estimated that the standard xG undervalues Messi’s GAX by around 17%. Compared with other elite high-volume shooters, Messi exceeds expectations by an additional 27%, suggesting that his finishing ability was being systematically underestimated by the very models designed to measure it.
What does this mean for the debate on data dependence? That one of the most widely used metrics in modern football—featured in broadcasts, guiding transfers, and used daily by analysts—has deep mathematical limitations that are not obvious at first glance. Using it correctly requires understanding what questions it can and cannot answer. As Davis and Robberechts conclude: xG is a valuable tool when used to understand from which areas good chances are created or which teams dominate tactically. But when used to judge individual player ability, without considering shot volume, shot type, or model biases, it can lead to incorrect conclusions.
This section summarizes the main findings of the academic article "Biases in Expected Goals Models Confound Finishing Ability," by Jesse Davis and Pieter Robberechts (KU Leuven, Dept. of Computer Science; Leuven.AI), published in 2024. The original text has been adapted and simplified for educational purposes. You can consult the full study at "Biases in Expected Goals Models Confound Finishing Ability"
Positional data and real-time GPS tracking
One of the major revolutions in modern analysis is the ability to record the exact position of players at every moment of the match. Thanks to optical tracking systems and GPS devices, millions of data points on movements, speeds, accelerations, and distances covered can be collected in real time.
This type of information makes it possible to analyze aspects that were previously almost invisible, such as space occupation, defensive shifting, or synchronization between lines. For example, the distance between defenders can be measured to evaluate the solidity of a block or detect imbalances in collective pressing.
In addition, real-time tracking facilitates decision-making during the match itself. Coaching staffs can access physical and tactical data almost instantly, helping them manage workloads, detect signs of fatigue, or adjust strategies based on team and opponent behavior.
This approach not only provides precision, but also turns analysis into a continuous process, where every action is recorded and can later be reviewed in great detail.
Big Data and tools such as StatsBomb, Wyscout, or Opta
The growth in data volume has led to the use of Big Data in football, where large amounts of information are processed to find patterns, trends, and relevant behaviors. This approach goes beyond match-by-match analysis, allowing entire leagues to be studied, players to be compared, and future performance to be anticipated.
In this context, specialized platforms such as StatsBomb, Wyscout, and Opta have emerged, collecting and structuring data from thousands of matches worldwide. These tools provide advanced metrics, interactive visualizations, and historical databases that facilitate the work of analysts, coaches, and scouts.
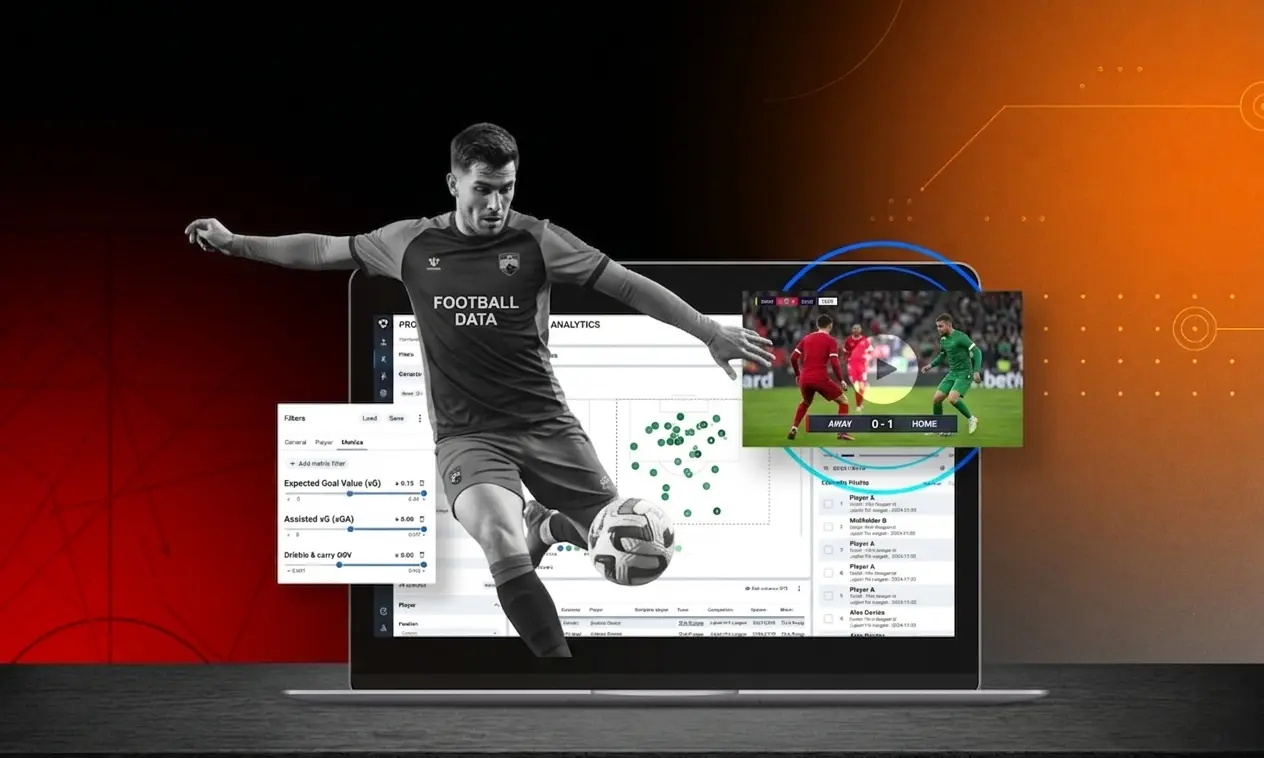
For example, they allow the comparison of player performance across different competitions, analysis of an opponent’s playing patterns, or identification of emerging talent based on objective indicators. They also integrate video and data, helping to contextualize each action within the real flow of the match.
The use of these platforms has helped professionalize analysis, making access to information broader and more precise. At the same time, it has changed how football is interpreted, adding a more analytical dimension without abandoning direct observation of the game.
Smart scouting: how data transforms transfers
The use of data has changed how clubs identify and evaluate talent. Traditional scouting, based on direct observation, is now complemented by databases that allow players to be filtered according to specific metrics such as offensive performance, defensive impact, or consistency.
This makes it easier to detect profiles that fit a specific playing system, even in less prominent leagues. It also reduces the margin of error by providing a more objective view of performance over time, not just in isolated moments. Even so, data does not replace qualitative observation, but acts as a preliminary tool to narrow and optimize the search for players.
The debate between coaching intuition in football and the use of data is increasingly common. However, framing it as a strict opposition can be simplistic. A coach’s intuition is based on experience, knowledge of the locker room, and contextual reading—elements that data cannot always capture.
On the other hand, quantitative analysis provides objective information that can confirm or challenge perceptions. In practice, both approaches tend to complement each other: data helps reduce uncertainty, while intuition allows for interpreting nuances that do not appear in numbers. Rather than choosing one over the other, the current trend is to integrate both perspectives in decision-making.
The technological gap between large clubs and smaller teams
Access to advanced technologies and large volumes of data is not equal for all clubs. Organizations with greater resources have specialized departments, sophisticated tools, and the capacity to process information on a large scale.
In contrast, smaller teams often work with more limited resources, which can create a disadvantage in areas such as opponent analysis, talent identification, or performance optimization.
However, the gradual democratization of some platforms and tools is partially reducing this gap. More and more clubs can access basic data and affordable solutions, helping to balance, at least in part, the use of analytics in football.
Data as a tool, not a substitute for tactical intelligence
The growth of data analysis has expanded the way football is understood, providing new perspectives and tools to study the game. However, its value lies in how it is used.
Data helps better interpret what happens on the field, but it does not replace tactical understanding, experience, or decision-making in complex contexts. In this sense, the balance between analysis and football knowledge remains key to understanding the sport in its full dimension.