We won this argument years ago. Our curve sprint project started at FSI Lab in 2017. When we published the first curve sprint test for soccer players in 2020 (Fílter et al., 2020), the purists called us crazy. Since then, the curve has gone everywhere. After our work, many more studies have made the curved sprint a key axis of their research. Match analysis backs it up: about 85% of sprints in a professional league are curved (Caldbeck & Dos'Santos, 2022). More than half of the sprint-related hamstring injuries in Spanish professional football happen on curved runs (Gandarias-Madariaga et al., 2025), so sprint work has to include curves. It's now part of the extra training for players who don't play (López Sagarra et al., 2026). And every year there are more devices that can measure it (gates, phones, radar, GPS) and more teams that train it. Nobody in a professional club still claims football sprints are linear. The Pac-Man idea is dead.
But at FSI Lab we always go one step further. Throughout this article, I'll show you new ways to use the penalty arc.
Many academies and elite teams already use the curve sprint test to measure sprint performance. Straight sprints over 20 or 30 m are still the classic way to find peak speed, and the curve gives you a sprint reference on the path players really run. But after our research, the arc gives much more. Monitoring hasn't caught up: most clubs still count accelerations and decelerations with one threshold for the whole squad, usually the one the GPS provider sets by default.
This article gives you numbers you can act on. The curve sprint test is your speed benchmark. The 17-0-5 turns one threshold for everybody into one threshold for each player.
Test 1: the curve sprint test (the one you already know)
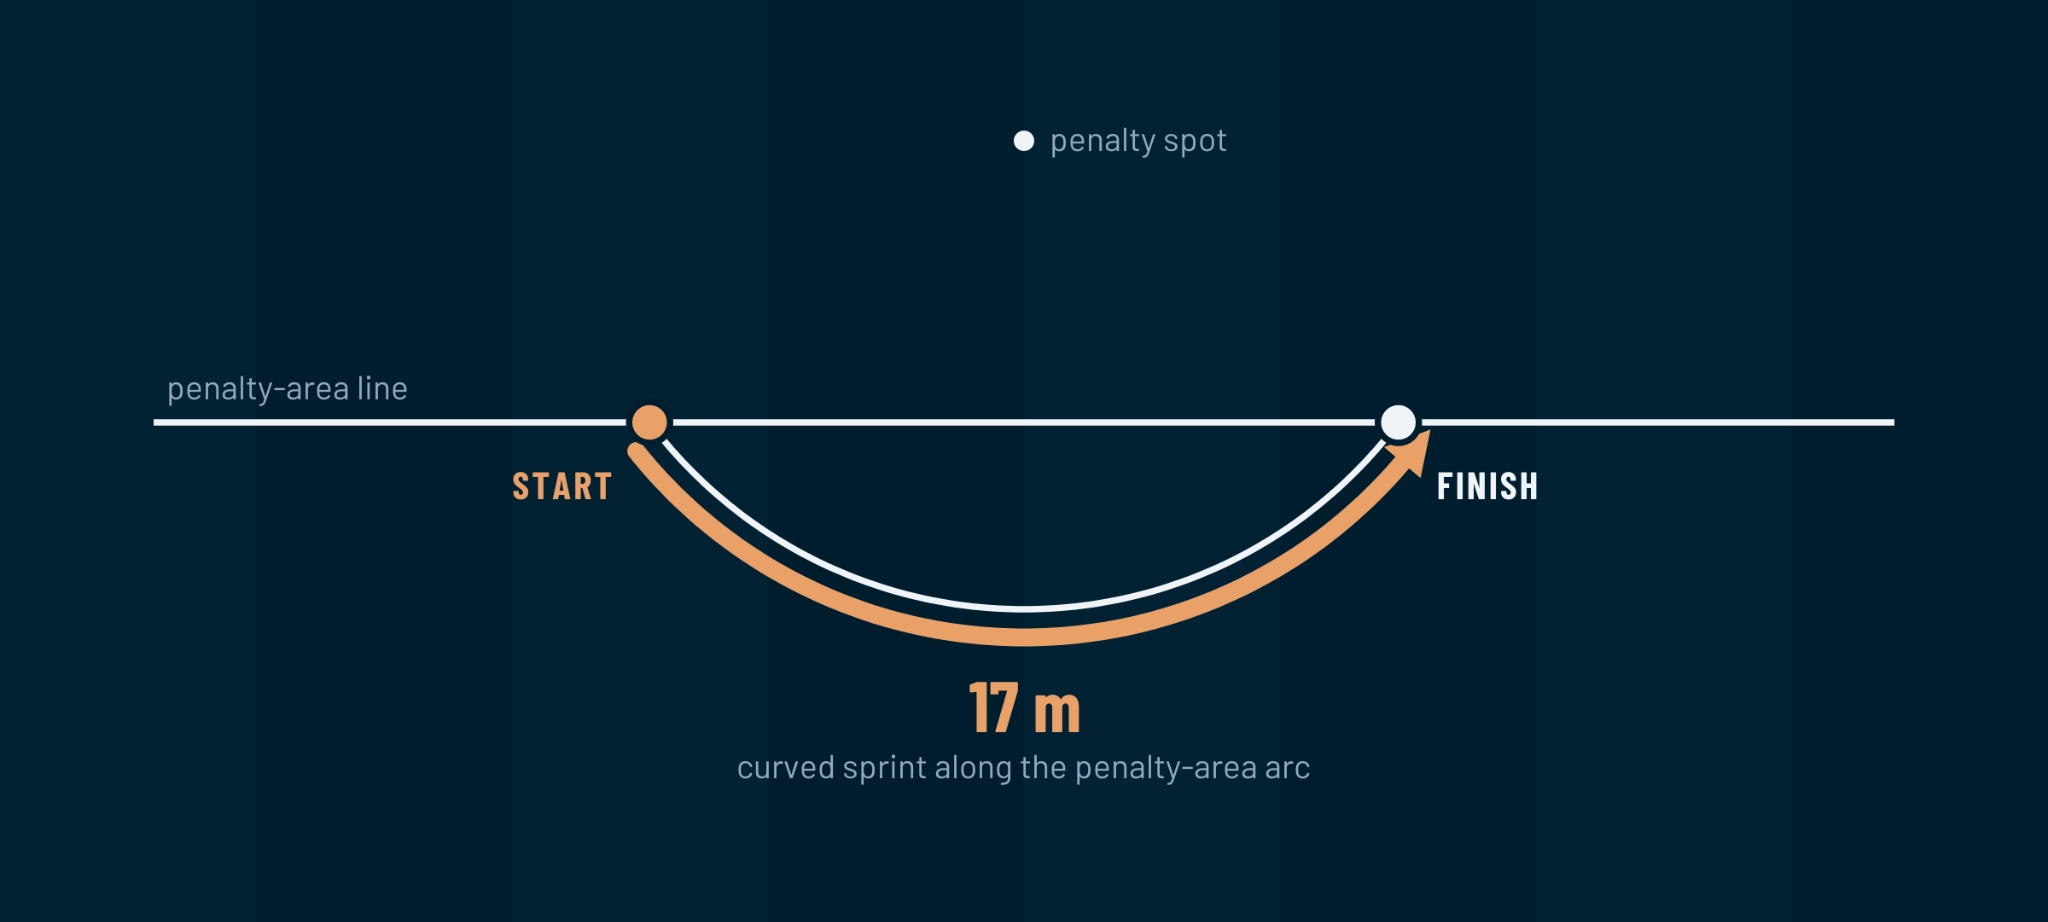
You probably know this one already. Every regulation pitch has the same 17 m arc with a 9.15 m radius, so there's no tape measure and no debate (Fílter et al., 2020). Put two timing gates at the start and the end of the arc, with the start line 1 m behind the first gate. Or just use a phone on the penalty spot. The player sprints through the end of the arc, with no braking. What you get is a time (Figure 1).
And what's a good time? My rule of thumb for the 17 m arc: below 2.6 seconds is top, between 2.6 and 3.0 is normal, and above 3.0 is poor. Use it as a starting point, then build your own squad's ranges. Timing method, surface and boots all change the number.
Here's what I see on the pitch: the curve is eco mode. The player changes direction without slowing down, with no real braking, unlike a sharp cut. So a time says nothing about how a player brakes. And tired players choose it by default: after minute 70, their angles round off on their own.
But a time is only the beginning. With a few small changes to the same test, we developed a second one at FSI Lab: the 17-0-5 Curved Sprint Test. Same spot, same lines, same size on every pitch, no tape measure. And it gives you something a stopwatch never will, useful every week to manage load, monitor the squad and guide return to play.
Test 2: the 17-0-5 (CS Deceleration Test), a first look at our data
Let me be honest first: this one is a pilot. We're running it at FSI Lab, with data from two professional clubs on two continents, and a manuscript is in preparation. I'm sharing it now because I'd rather you try it with your own team than wait for the paper.
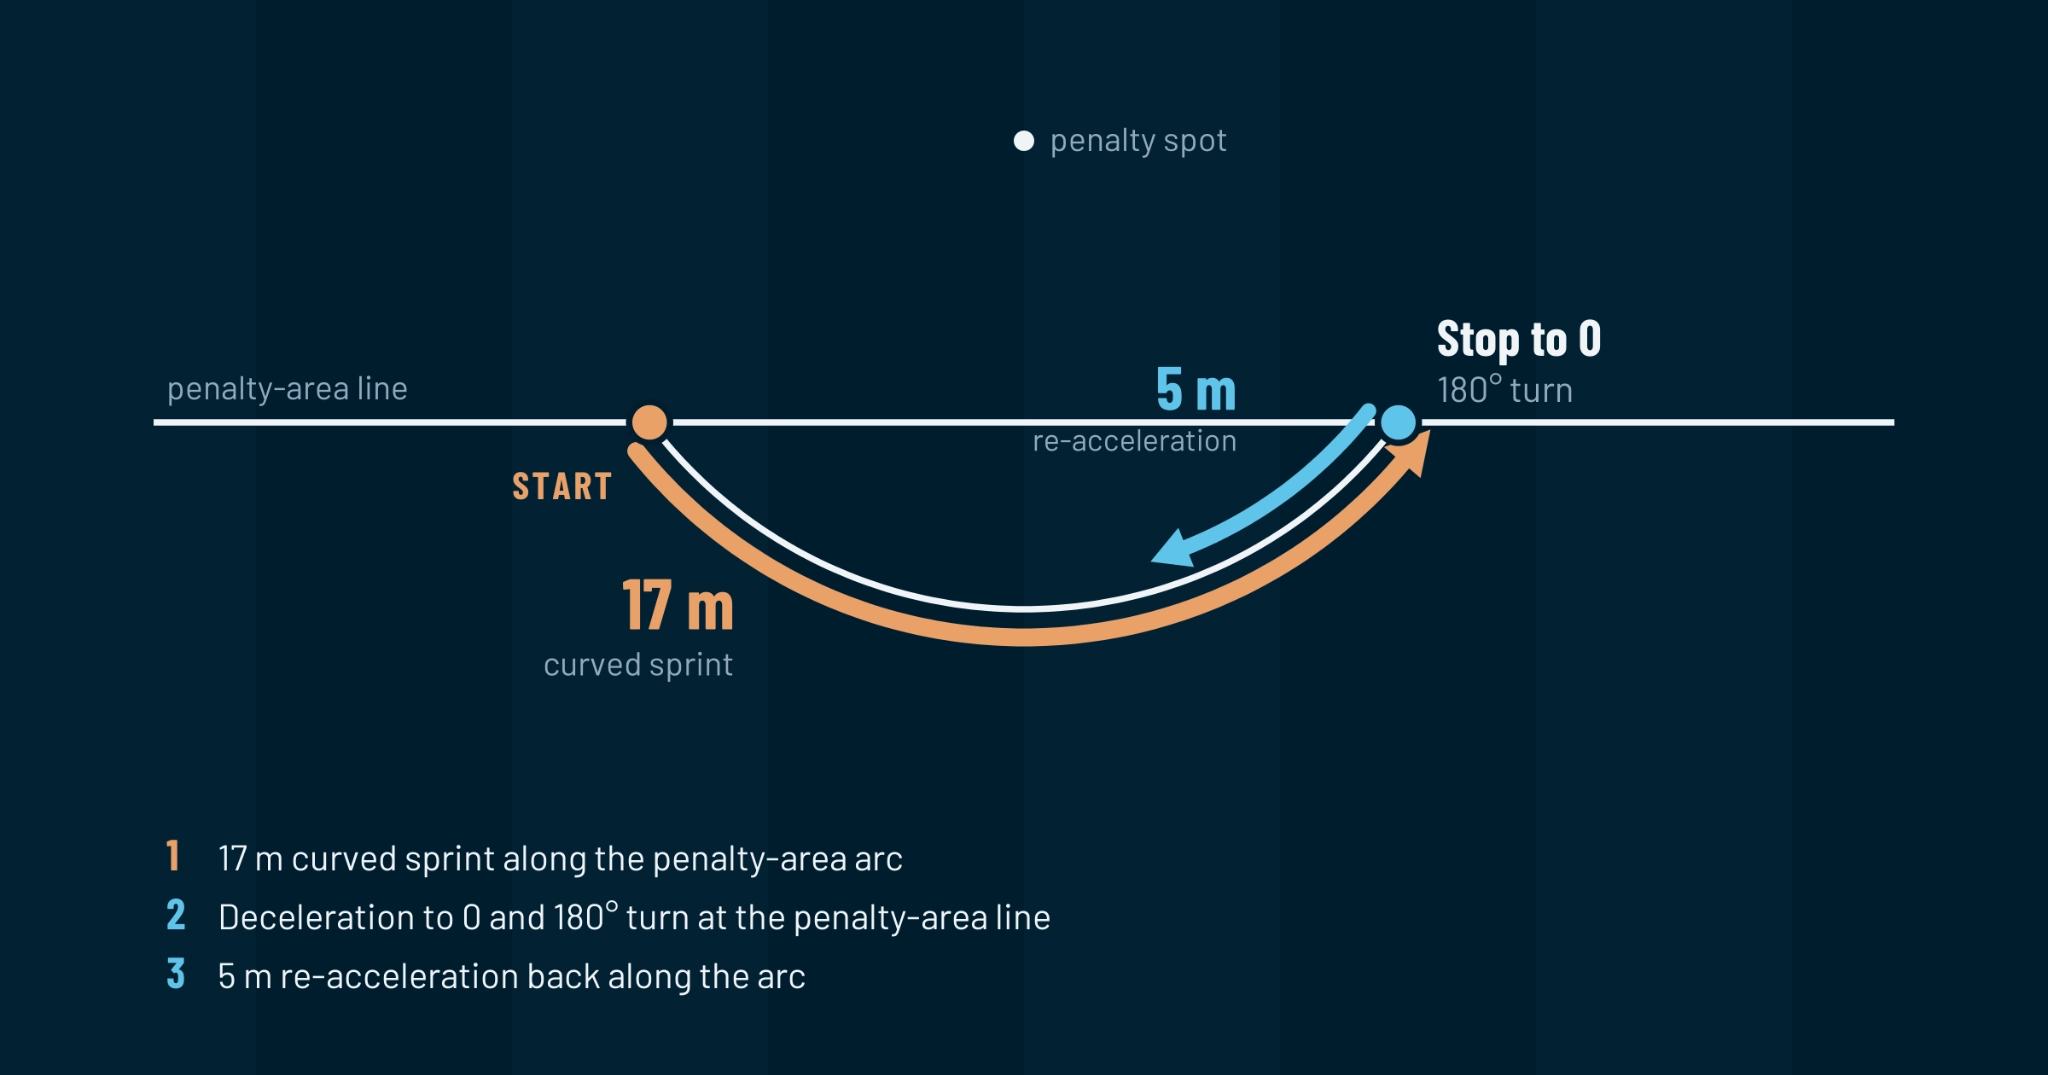
The idea is simple. Same start, same arc. But this time the player brakes to a full stop at the penalty-area line, turns 180° and sprints 5 m back along the arc, so everything happens on a path the game really uses (Figure 2). No gates here: what matters is the GPS. Three attempts, four minutes per player, and you're done.
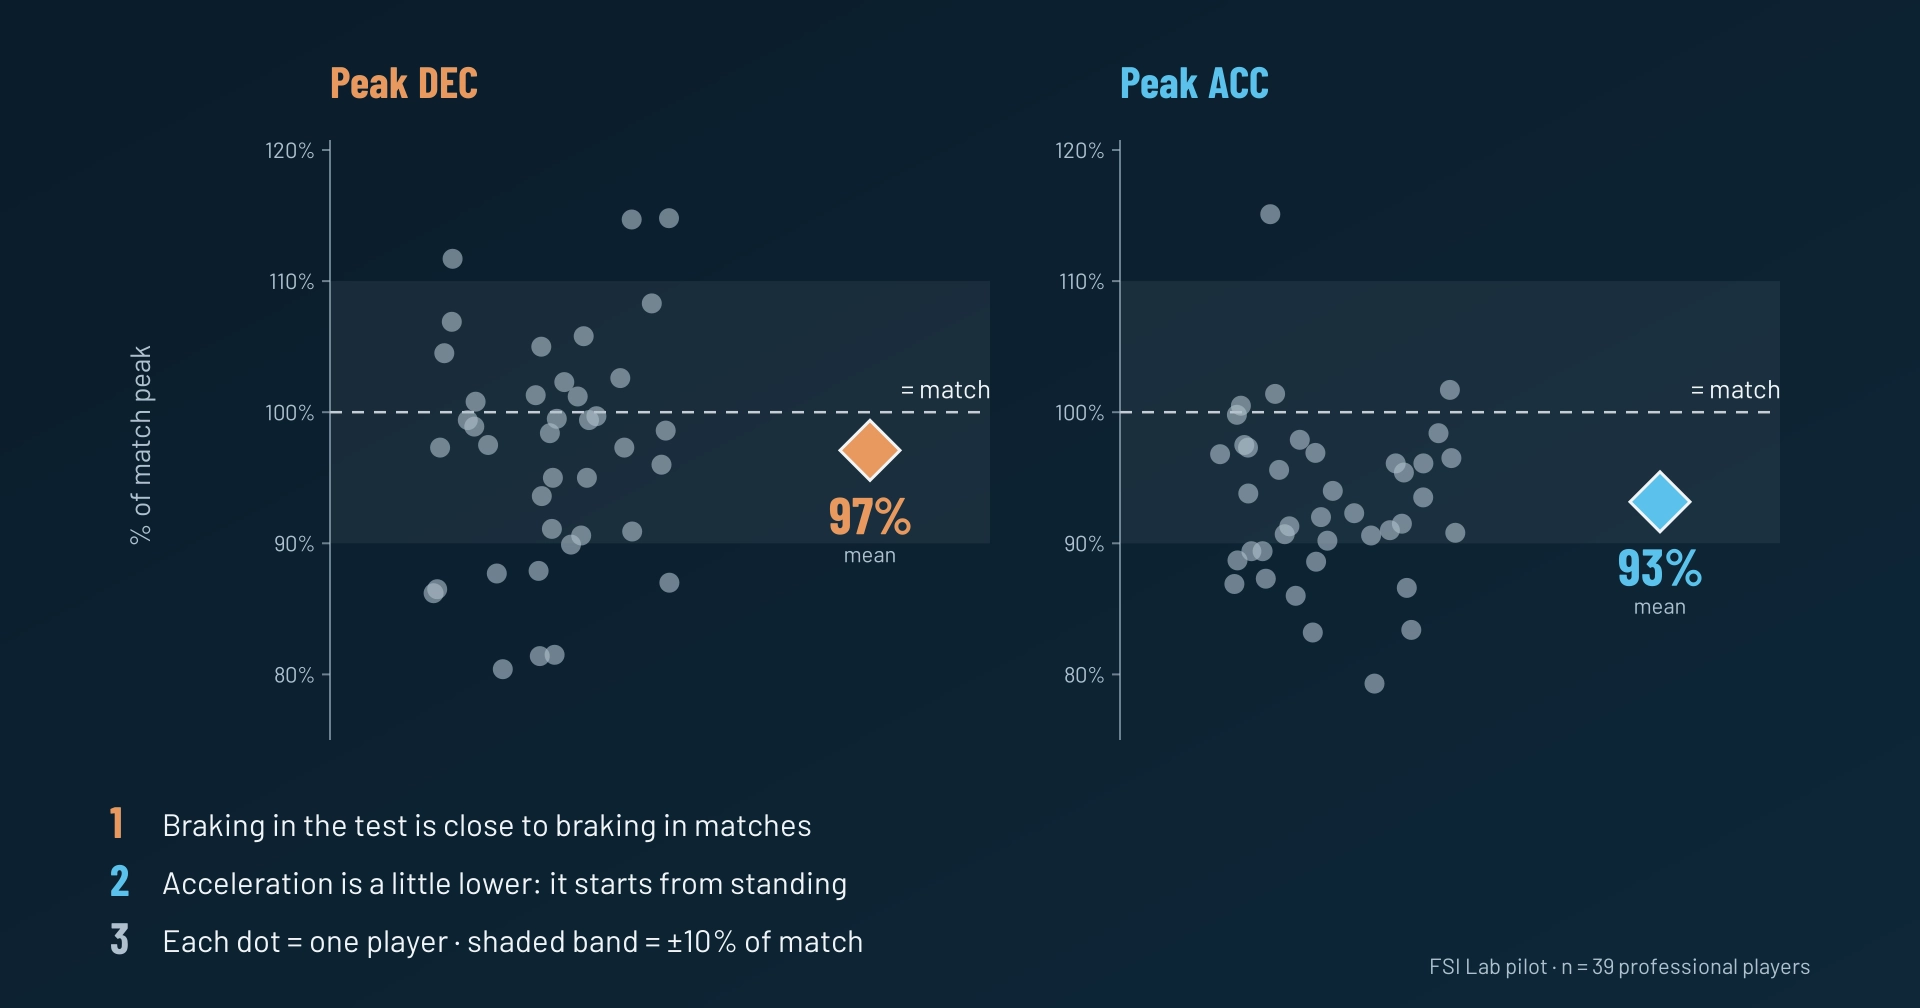
What comes out is each player's best acceleration, best braking and entry speed. On average, braking in the test is very close to players' best braking in matches (97–99%, Figure 3). And the match number can even be overestimated, because contacts like tackles and pushes can inflate it. Four minutes on the arc, almost match-day braking. It doesn't replace each player's match profile, though: from player to player it varies a lot. Acceleration counts too: it comes out at 93–94% of match values. But braking is where our data are strongest, so think of it mainly as a braking test. And here's the best part: you can measure it every week. In a match, that braking may or may not happen. On the arc, it always does. And everyone can do it, including substitutes and players back from injury. Entry speed matters too. Players start braking at about 76% of their top speed, almost exactly the speed of pressing in matches (about 77% according to Buchheit et al., 2024). Pressing is arguably the braking action par excellence in football, so the test brakes from the speed the game asks for.
If this sounds familiar, it's because it follows the same idea as the 5-0-5 work by my FSI Lab colleagues (Pimenta et al., 2026), with very similar values. Already running the 5-0-5? Keep it. The 17-0-5 just adds the curve, on lines that are already painted.
Two players, two decisions
Let's put faces on it: same test, two players (Figure 4). Everything starts with the ratio between braking and acceleration, compared with your squad. It tells you whether a player is more of an accelerator or more of a decelerator, and that decides which micro-doses of strength work you add in the gym.
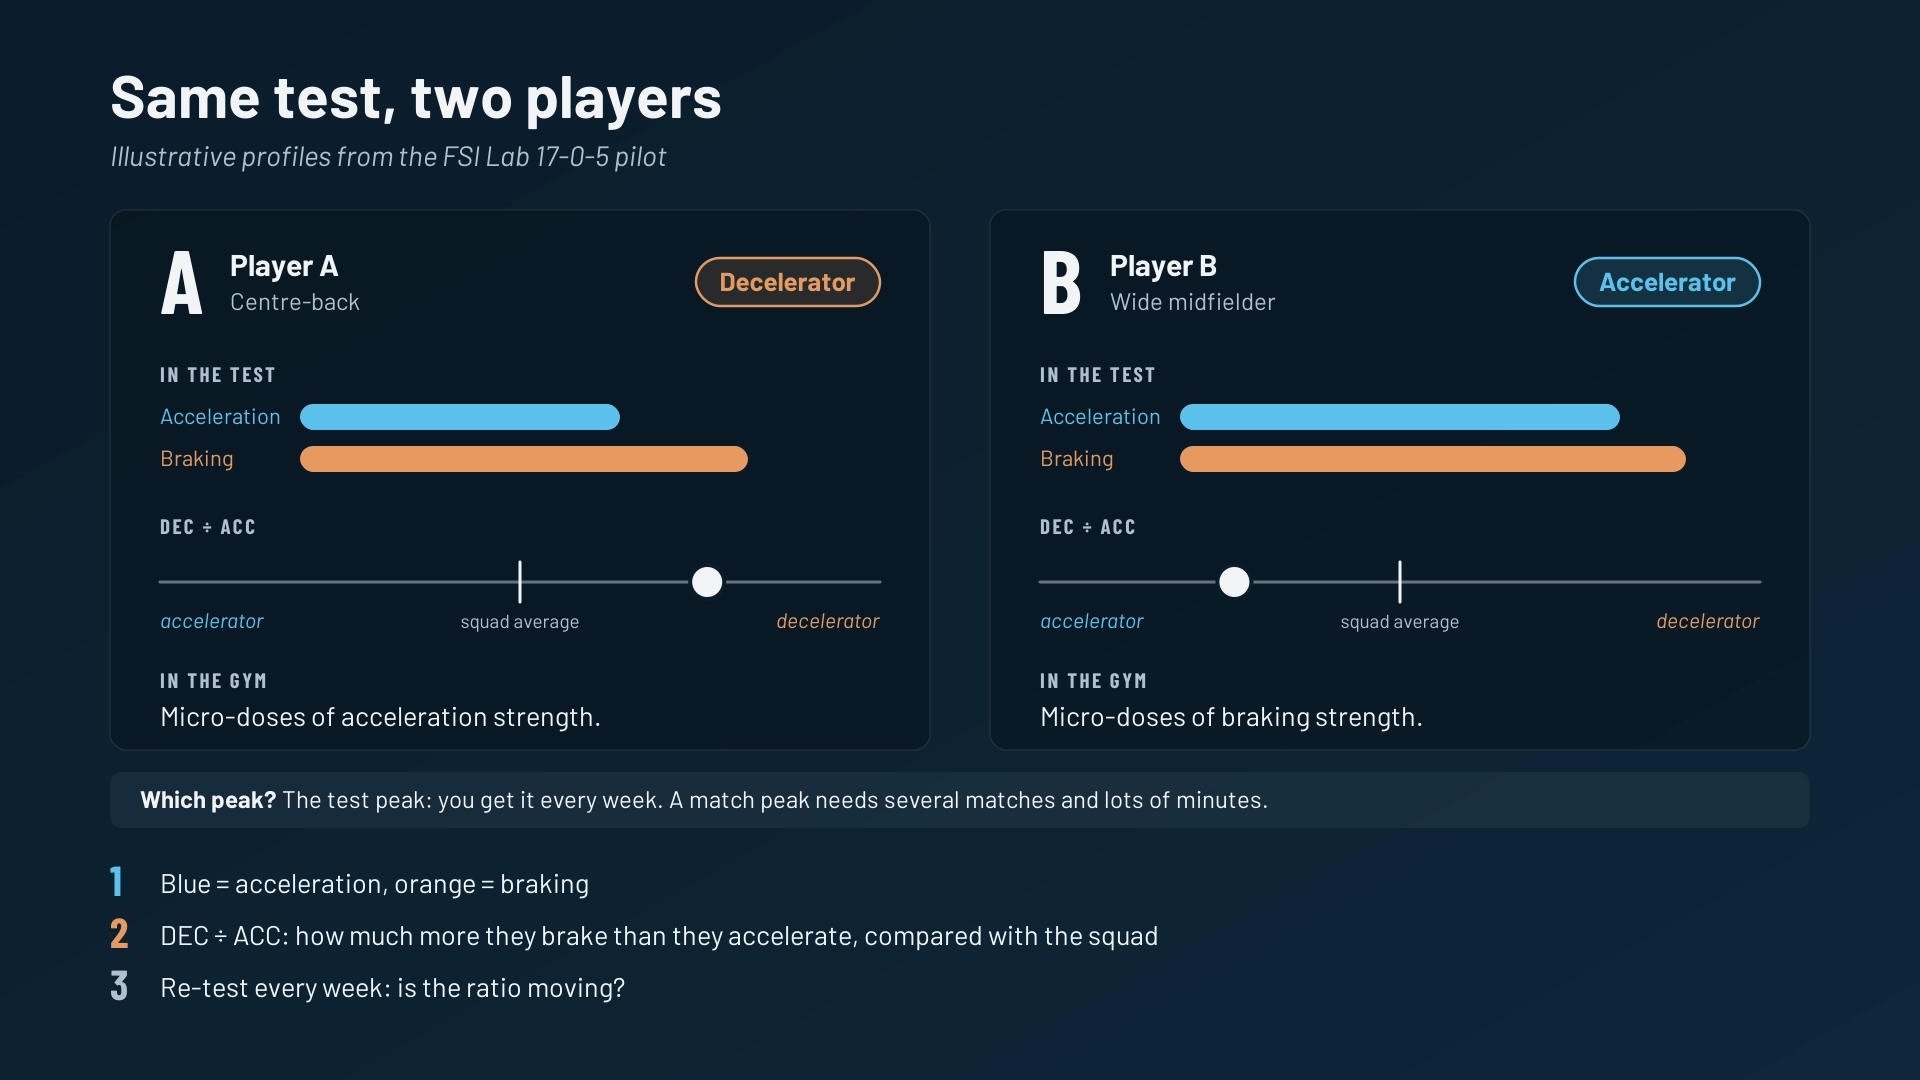
- A is a decelerator: they brake far harder than they accelerate, so their ratio is high. I'd add micro-doses of acceleration strength in the gym.
- B is an accelerator: they brake only a little harder than they accelerate, so their ratio is low. I'd add micro-doses of braking strength in the gym. Same test, opposite decisions.
What about the match? Compare test and match only to decide which peak to use. A match peak needs several matches and lots of minutes per player, so it's hard to get. The test peak is the one you can count on every week.
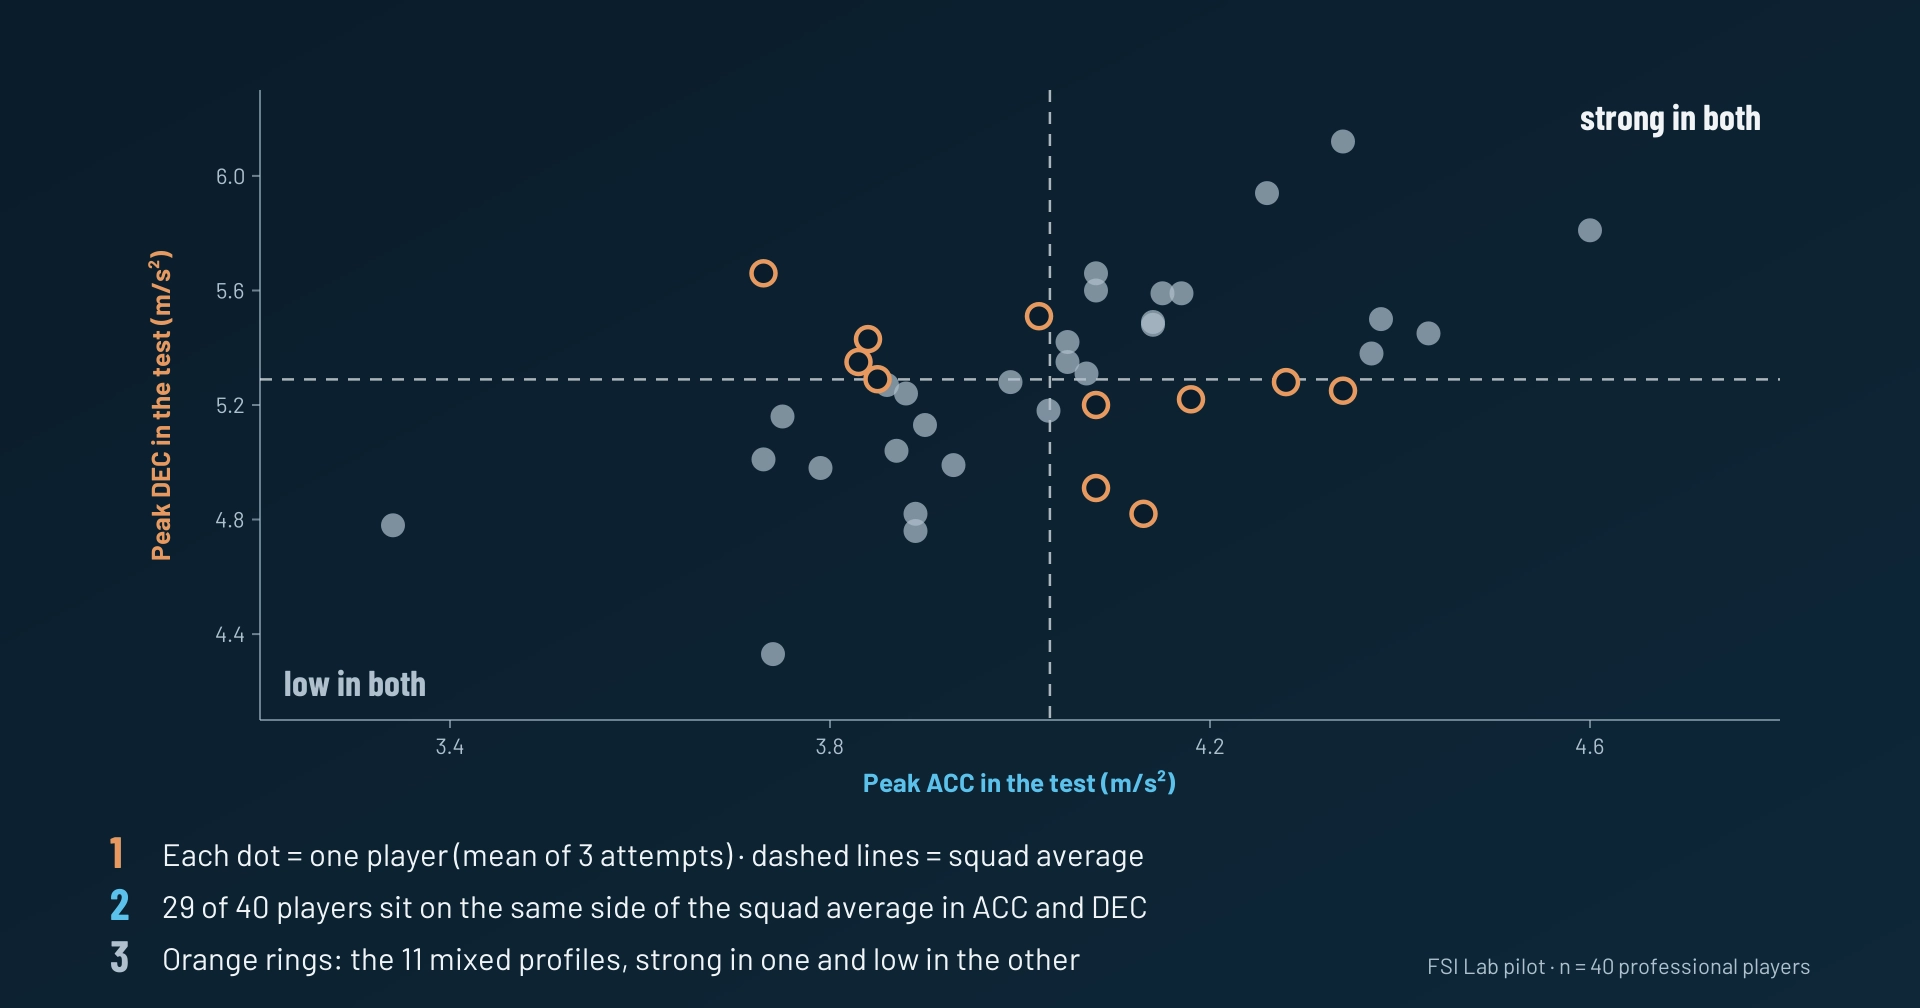
Don't expect neat types, though. In our pilot most players were strong in both or low in both, and clearly mixed profiles were the minority (Figure 6, in "How to read it"). Soon we'll have more data on which ratios work as benchmarks.
What this does to your load report
Think about how your load report works today. Every acceleration or braking above 3 m·s⁻² counts as one event, for every player. But 4 m·s⁻² is moderate for one player and nearly maximal for another. Silva et al. (2026) looked at more than 3,000 changes of direction in matches. They concluded that fixed thresholds are probably too low, and that the prescription should consider the angle, the entry speed and the position.
Now flip it. Give each player their own peak, and measure every acceleration and braking as a percentage of it. Then count events in bands (e.g. above 90%, 75 to 90%, below 75%; adjust them to your squad). Repeated near-maximal braking becomes visible instead of disappearing in the average. And you don't need a new provider: one peak per player and one extra column.
Here's what I find most useful. With each player's own peak, you see whether they did abrupt accelerations and brakings in the match, and how many. That decides their recovery. A player who braked near their maximum again and again doesn't need the same recovery as one who never got close to their peak. Until now, your load report gave both the same row.
Report the percentage, not the raw number
Measuring ACC and DEC against each player's own peak, instead of one threshold for everybody, has a name behind it at FSI Lab: our director Fábio Nakamura, one of the pioneers of this analysis (Silva et al., 2024). The work of our FSI Lab colleague Ricardo Pimenta (Pimenta et al., 2026) points the same way: raw values hardly repeat from one attempt to the next, but as a percentage of each player's maximum they do. Log the raw number and you log noise. Log the percentage and you can track it.
So: monitor it weekly, not annually
The slot is the key. Ricardo Pimenta and colleagues proposed fitting a short change-of-direction test into MD-4 or MD-3 as weekly monitoring, not as a testing day (Pimenta et al., 2026). We built the 17-0-5 for exactly that slot, with the curve added.
Those four minutes do three jobs. They give you every player's best acceleration, best braking and arrival speed. They work as the last part of the warm-up. And they train what they measure: regular braking work, which McBurnie et al. (2022) propose as a possible "vaccine" against injury. That's reason enough to fit them into the weekly plan or a return-to-play process.
The result: every week you read each player's ACC and DEC against their current peak, not against a preseason number you stop trusting by November. And it works for everyone, even players without match minutes.
What are we tracking now, with the same players across the season? Three questions. In busy weeks, does braking drop before acceleration? After an injury, which one comes back last (my bet is braking)? And do braking values rise after a block of braking work?
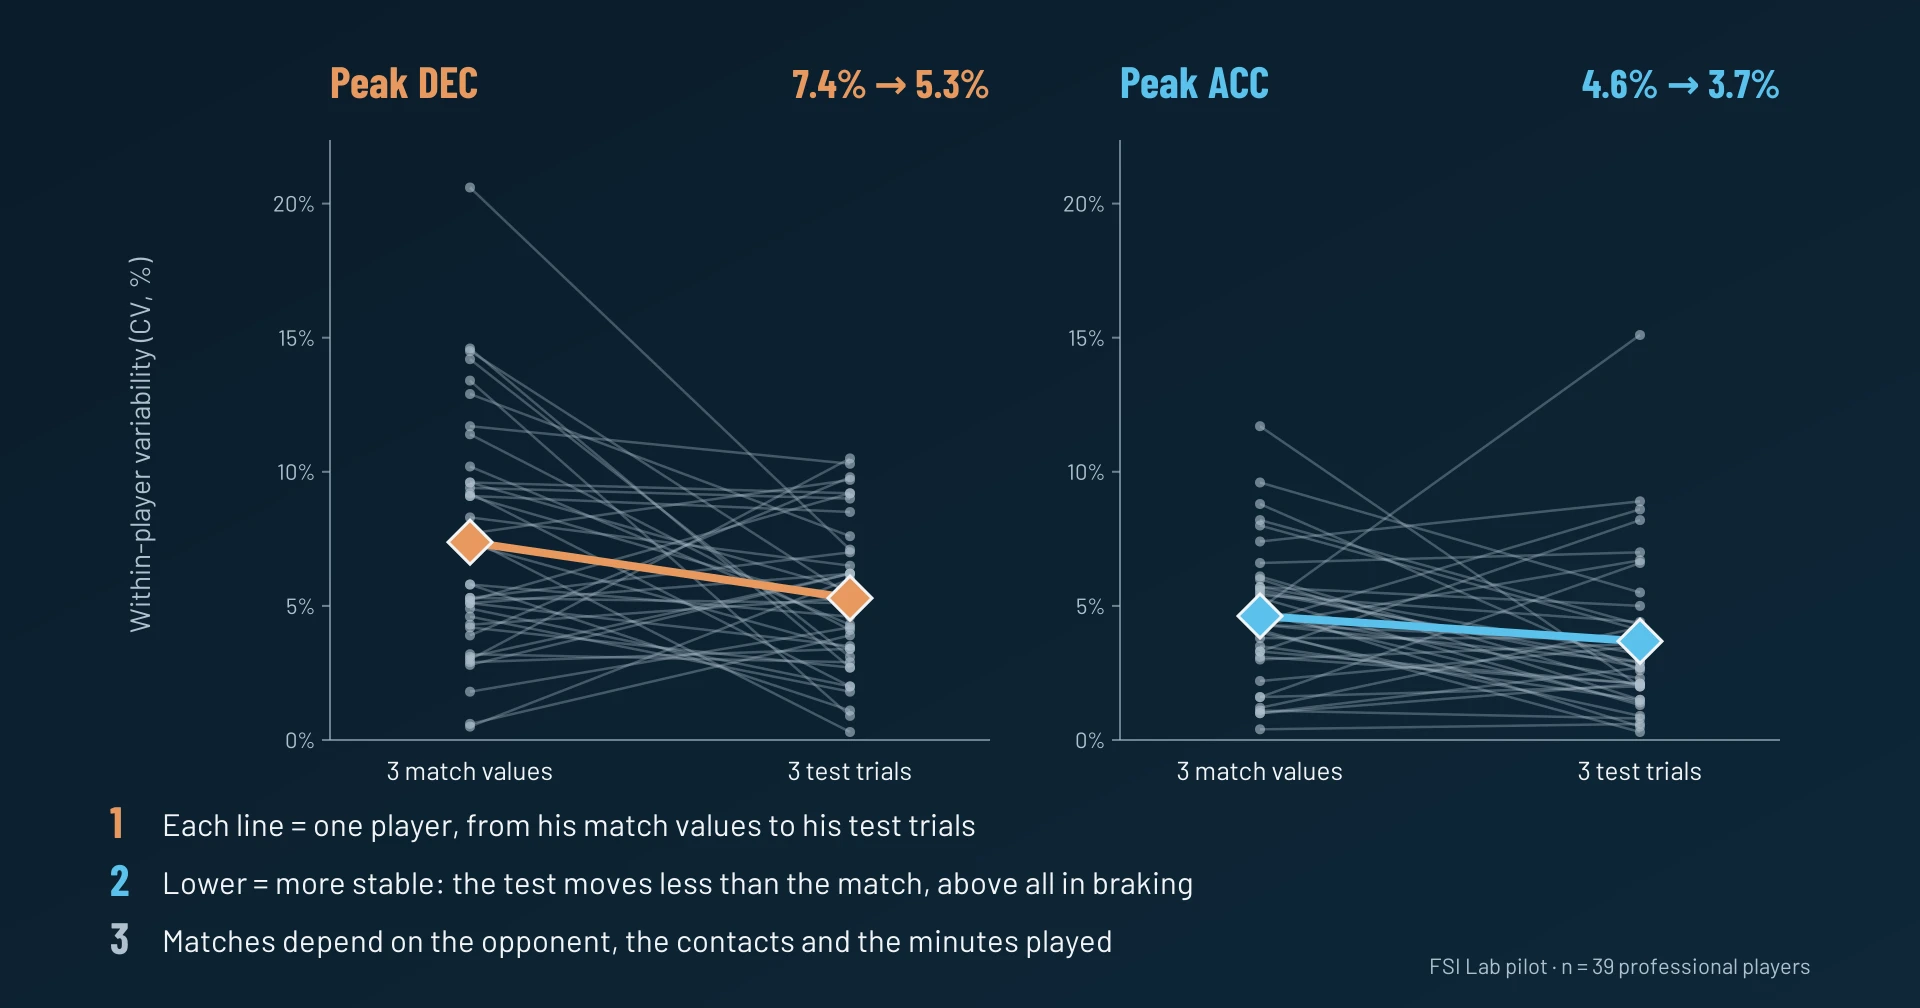
The match data already show why weekly matters: more than half our players had at least one match where their best braking fell below 90% of their own peak. And the test is steadier than a match, which depends on the opponent, the contacts and the minutes played (Figure 5). And that's with the match data already filtered: each player's 3 best values from 5 matches with more than 60 minutes. Raw match data would be much more variable.
How to run it
Put it at the end of the warm-up on MD-4 or MD-3, before the main pitch work. Never on MD+1 or MD-1. All you need is one GPS unit per player (same model and settings as in matches) and the penalty arc.
Warm up with five minutes of jogging and dynamic drills, then add two or three controlled curve runs with braking. Then the test: start from standing, sprint flat out for 17 m along the arc, brake to a full stop at the line, turn 180° and sprint 5 m back along the arc. Three attempts, two minutes' rest. If the player slips or leaves the arc, it doesn't count.
From each attempt, keep three things: the best acceleration (the one out of the start), the best braking (before the turn) and the arrival speed. Then use two references. The average of the three attempts shows how a player changes from week to week. The best attempt is their ceiling: the number you measure match and training accelerations and brakings against, in bands for each player. Update both every week.
How to read it
Where do you start? In our pilot, with professional male players and 10-Hz GPS, the typical player brakes at around 5.3 m·s⁻² and accelerates at around 4.0 m·s⁻². So braking is about 30% higher than acceleration. Every single player braked harder than they accelerated, and most were between 1.2 and 1.4 times. Use that ratio as your first compass. Calculate it for each player, compare it with your squad's and with their own over the weeks, and build your own squad's numbers within a few weeks. What matters is how it moves.
Two cautions from our data. Most players are strong in both acceleration and braking, or low in both (Figure 6), so read the level first and the balance second. And the ratio from a single attempt is noisy: use the average of the three attempts, and only trust a change in the ratio of more than about 0.05. It's a compass, not a label.
Then check the approach. Players arrive at the brake at around 24 km·h⁻¹, about 76% of their top speed. If a player is well below that, they didn't go flat out, so repeat the attempt: a soft approach means a soft brake.
And how do you know a change is real? Trust changes of more than ~0.2 m·s⁻² in braking or ~0.1 m·s⁻² in acceleration, using the average of three attempts. Anything smaller is just the test talking. Treat these numbers, and the 0.05 for the ratio, as minimums: they come from attempts on the same day, and we're still measuring how much these values move from one week to the next. If braking drops that much two weeks in a row, check load and recovery before adding more braking work.
Toolbox
In a return-to-play process, you control the curve itself. The best exercise for curved sprinting is curved sprinting: two to four reps on the arc, with full rest between reps, early in the session.
My rule for dosing is simple: change the radius, not the load, because centripetal force is mass × velocity² ÷ radius. Start wide and then tighten. If a player drifts off the arc, widen the radius so the curve is gentler, before you add any weight.
On tight radii I'd choose a vest over a sled, because the extra weight on the trunk makes the sideways demand bigger. Sleds still work on wide arcs.
With the team it's the other way round: don't prescribe the curve, design the game. In a match the opponent decides the angle. So play with the structure of the small-sided game (pitch size, goal direction, offside) and the curves appear on their own, supporting the same process you control on the arc.
Then use what the test tells you to choose roles inside those games. Compared with teammates, the 17-0-5 shows whether a player stands out in acceleration, in braking, in both or in neither. Give each one the role that brings the stimulus they need: pressing or recovering if their braking is lower, attacking space from a standing start if their acceleration is lower. Controlling load through game situations is the research line of our FSI Lab colleague José Asián-Clemente. Read it on our website.
Where it goes in the week
On MD-4 or MD-3, do the 17-0-5 at the end of the warm-up, then your curve sprints in the speed block, two to four reps. MD-2 is for small-sided games with constraints, so the curves appear on their own, and no isolated sprint work. The curve sprint test stays for testing points and for return to play, when you want the time. And never do either test on MD+1 or MD-1: both are maximal.
Take-homes
- Many academies and elite teams already use the curve sprint test for sprint performance. The arc gives more, and load thresholds haven't caught up.
- The penalty arc gives you two free tests, the same on every pitch: the curve sprint test (time) and the 17-0-5 (best acceleration and braking).
- Give each player their own peak and log the percentage, not the raw number. You'll see how many abrupt accelerations and brakings they did in the match, and what recovery they need.
- Four minutes a week at the end of the warm-up: on average, braking close to match peaks, for every player, plus a training stimulus.
- Read each player's ACC/DEC ratio against your squad's and their own over the weeks: it tells you which micro-doses of strength to add in the gym. Use the test peak, because match peaks are hard to get. The ACC/DEC ratio is a compass, not a label.
- The 17-0-5 is a pilot in progress. If you run it, tell us what you find.
References
- Buchheit, M., Lázár, Z., Sinkó, B., Kolozs, B., Echevarne, A., Guerra, J., Krotki, P., & Eriksrud, O. (2024). Assessing locomotor demands of pressing actions in elite football: Insights for testing and training prescription. Sport Performance & Science Reports, 225. https://sportperfsci.com/wp-content/uploads/2024/05/SPSR225_Buchheit.pdf
- Caldbeck, P., & Dos'Santos, T. (2022). A classification of specific movement skills and patterns during sprinting in English Premier League soccer. PLoS ONE, 17(11), e0277326. https://doi.org/10.1371/journal.pone.0277326
- Fílter, A., Olivares, J., Santalla, A., Nakamura, F. Y., Loturco, I., & Requena, B. (2020). New curve sprint test for soccer players: Reliability and relationship with linear sprint. Journal of Sports Sciences, 38(11–12), 1320–1325. https://doi.org/10.1080/02640414.2019.1677391
- Gandarias-Madariaga, A., Martínez-Serrano, A., Alcaraz, P. E., Calleja-González, J., López del Campo, R., Resta, R., & Zubillaga-Zubiaga, A. (2025). Hamstring strain injury patterns in Spanish professional male football (soccer): A systematic video analysis of 78 match injuries. Journal of Functional Morphology and Kinesiology, 10(2), 201. https://doi.org/10.3390/jfmk10020201
- López Sagarra, A., Barba Balda, E., Carruthers, T., Granero Gil, P., & Buchheit, M. (2026). Hitting the metrics, missing the angles: Closing the directional gap in run-based compensatory training. Sport Performance & Science Reports, 316.
- McBurnie, A. J., Harper, D. J., Jones, P. A., & Dos'Santos, T. (2022). Deceleration training in team sports: Another potential 'vaccine' for sports-related injury? Sports Medicine, 52(1), 1–12. https://doi.org/10.1007/s40279-021-01583-x
- Pimenta, R., Antunes, H., & Nakamura, F. Y. (2026). Acceleration and deceleration profiles: Comparison between the 5-0-5 test and seasonal peak player performance. Sports, 14(1), 9. https://doi.org/10.3390/sports14010009
- Silva, H., Nakamura, F. Y., Serpiello, F. R., Ribeiro, J., Roriz, P., & Marcelino, R. (2024). Adapting the percentage intensity method to assess accelerations and decelerations in football: Moving beyond absolute and arbitrary thresholds. Sports Biomechanics, 23(12), 3514–3525. https://doi.org/10.1080/14763141.2024.2393188
- Silva, R., Marcelino, R., Lima-Alves, A., Ribeiro, J., & Dos'Santos, T. (2026). Characterizing change-of-direction demands in professional soccer match play using deceleration and acceleration metrics. International Journal of Sports Physiology and Performance. https://doi.org/10.1123/ijspp.2026-0174
Powered by Froala Editor